Welcome to the new Khalsaspad › Forums › Traders Talk Forums › Weekly trading discussion threads › August 2019
- This topic has 378 replies, 5 voices, and was last updated 4 years, 11 months ago by
cimac.
-
AuthorPosts
-
August 1, 2019 at 18:44 #27216
Small short sp500 at 3001 … stop 3300 … limit 2200
Closed at 2970
Never give up, never surrender.
August 1, 2019 at 18:46 #27217Small short Dow at 27000 … stop 34000 … limit 18000
Closed at 26800
Never give up, never surrender.
August 1, 2019 at 19:11 #27218Wednesday I bungled the FMOC drop but today when
the US markets did a repeat drop I got a pay off.Trump announced another 10% tariff on $300 billion
of imports from China.Never give up, never surrender.
August 1, 2019 at 20:45 #27219US action yesterday and today … the twin falls … reminds
me of a pattern that hatman told me about when we were
on the old kpad … could have been back in 2005.Let’s see if he remembers, when he walks up tomorrow.
Never give up, never surrender.
August 2, 2019 at 04:19 #27220US action yesterday and today … the twin falls … reminds me of a pattern that hatman told me about when we were on the old kpad … could have been back in 2005. Let’s see if he remembers, when he walks up tomorrow.
I’m too old these days to remember much Chris – I can barely remember what I said yesterday let alone in 2005!
August 2, 2019 at 04:27 #27221SPX: the market rallied just above the target area then plunged. It shows the risk of playing against the trend.
Interestingly at 2943 the entire action from the top counts as a completed larger ABC pattern, with the drop yesterday being a five wave C. It stopped at 2945 which might be enough, or it might try for the ‘perfect’ 2943.
We are still within the accepted day or two allowance for the Bradley date of August 30, so this can still be the ‘Bradley low’ with a possible overlapping sloppy rally from now into the August 8/11 area.
There are a number of targets for a rally shown on the chart which range between 2990 and 3001. However as we saw yesterday markets have a tendency to be disrespectful of logical bounce targets particularly if it thinks shorts lie there.
Today is employment numbers. Also President Trump’s office has announced that he will make a ‘statement on EU trade’ at 1.45ET.
I’m out of the market and I certainly don’t want today’s volatility risk, so I’ll wait to see how the market develops and if necessary relax until the possible target area of August 8/11.
Attachments:
You must be logged in to view attached files.August 2, 2019 at 05:06 #27223NASDAQ: the Nasdaq Comp has exactly the same pattern as SPX, with a completed C wave down to 8080. There’s a potential 0.618 retrace line at 8235 which coincides with the line of resistance. However it violated that line once so it might no longer be valid. Or it might try again and this time find the trapdoor has been closed.
Or something else might happen….
Attachments:
You must be logged in to view attached files.August 2, 2019 at 05:09 #27225Well you have had a full and interesting life David so
it’s no surprise you have forgotten our chat.I was about how when a 4th wave down ends you sometimes
see a double drop that looks like ‘two little feet’ if
viewed on a bigger picture time frame.Never give up, never surrender.
August 2, 2019 at 09:06 #27226GBPEUR: The Pound has dropped to where I projected wave 1 could end in the 1.085/7 area. It hasn’t quite touched it and might be forming a small 4th wave. It bounced quickly to 1.10. It might make another attempt at 1.085/7.
I’ve calculated Fib projections down to the eventual target at 0.95. By coincidence or fate, this produces a third wave projection at exactly 1.00. Interesting.
I haven’t shown any time projections (impossible) so it might all be quick or strung out.
I imagine the Pound will have a struggle getting through 1.00 so the 4th wave might be quite a long sideways triangle instead of a quick bounce upwards.
For this projection to be valid the Pound must bottom for wave 1 either now in slightly lower at 1.085/7 and then bounce upwards to 1.125 or so which coincides with the 0.236 Fib and wave iv of wave 1.
A very interesting chart, and the potential for handsome profits in the months ahead if all goes according to plan.
Attachments:
You must be logged in to view attached files.August 2, 2019 at 10:10 #27228Good Morning Cimac Hatman et al
Good luck to us all
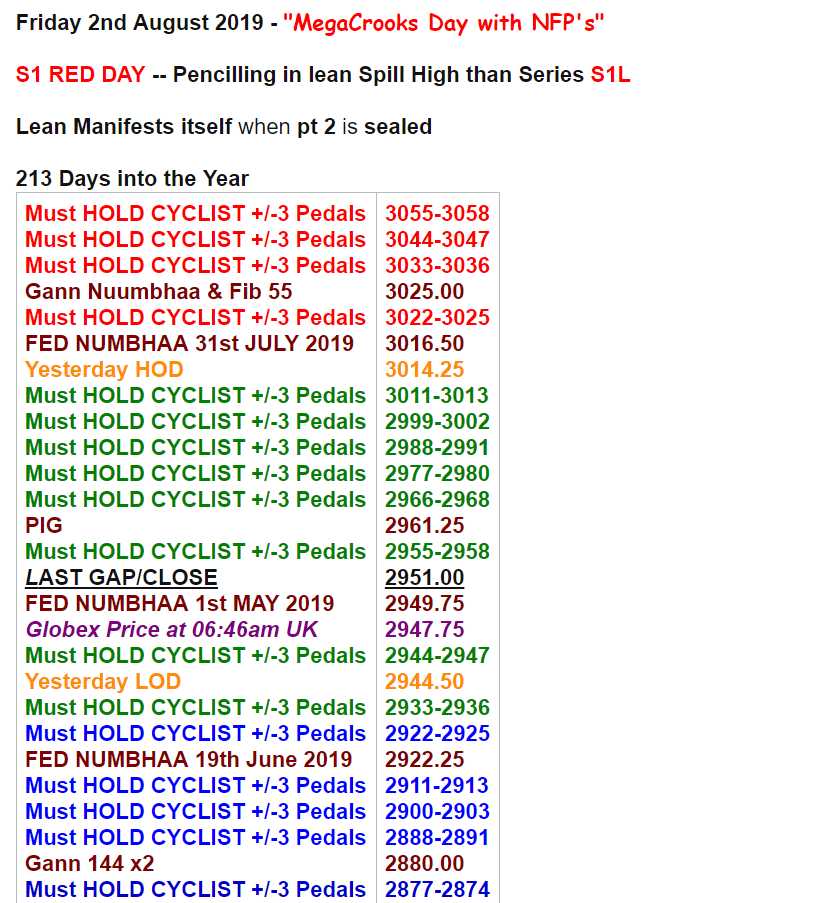
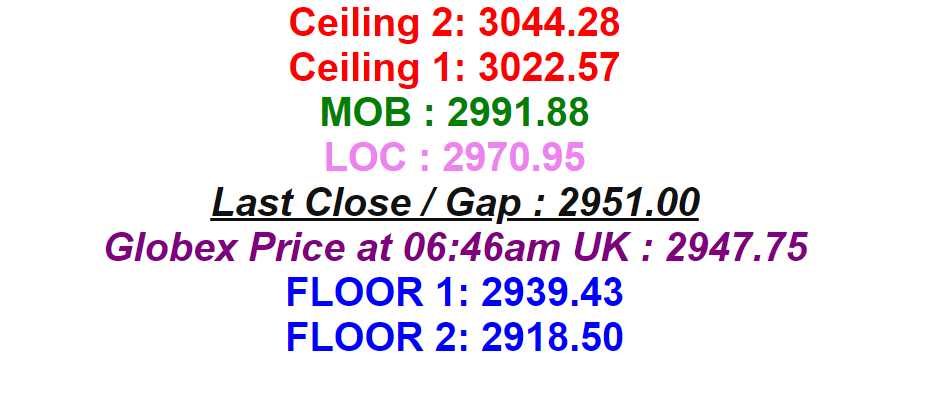
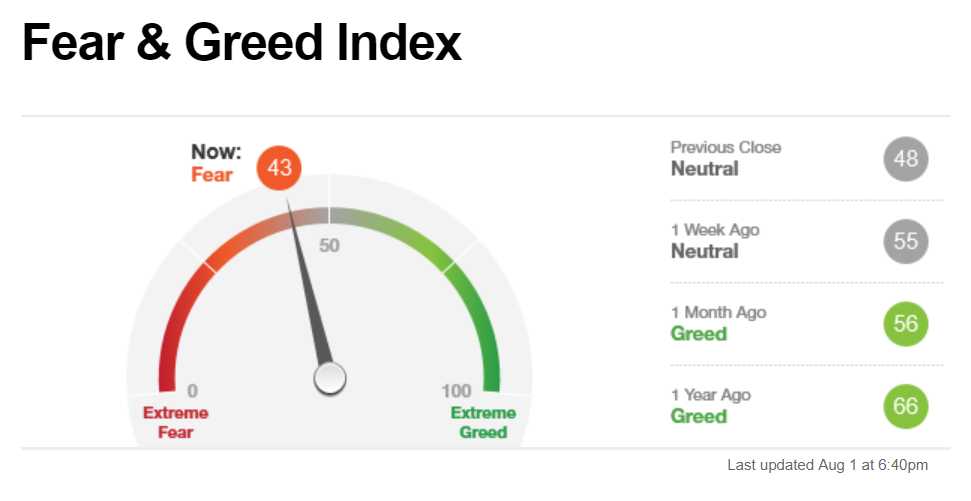
Small droplets of rain turn into Rivers, Streams and Mighty Oceans
August 2, 2019 at 15:43 #27229Well Trump has weakened his chance of re election
with the US markets casting their vote.Odds are he gooses the markets back up again.
Never give up, never surrender.
August 3, 2019 at 02:00 #27230SPX: the interesting and accurate ABC pattern shown on my earlier chart was quickly and decisively broken by the market which continued downwards with some force. Unfortunately I don’t have any valid logic for where the market stopped and I cannot see a completed downwards pattern at the moment. Of course the market will do what it wants to do, but I have to wait until I can calculate something that has a high degree of success.
On the daily chart you can see that all potential lines of support were broken on Friday – the important one being 2960. Yes, SPX printed a potential reversal candle, which might indicate it wants to go back up to check the 2960 trapdoor has been closed. Unfortunately, as we saw a few days ago, these lines of support/resistance tend to get broken in unforseen ways because the market ‘knows’ the shorts are waiting there.
All in all, this chart strongly suggests that an important top and reversal has happened, and with key support broken I imagine that everyone is now looking for an opportunity to sell.
Attachments:
You must be logged in to view attached files.August 3, 2019 at 05:26 #27232Late on friday I opened this trade …
Small short Dow at 26500 … stop 30000 … limit 18000
I am not convinced the ‘h’ is in but this trade gives me
the ratio of Reward 2 vs 1 Risk that I always seek.Never give up, never surrender.
August 3, 2019 at 07:26 #27233SPX: looking at the S&P I see the possibility of a count that uses the key support line of 2960. It’s a bit scrappy, but given that the S&P completed a clean ABC down to that 2960 area, it’s possible to suggest that the wiggle in that area was a B wave. If so, wave C down from there is 0.618 at 2913, and it reached 2914.
I’m not convinced, but at least it’s an analysis of sorts.
If correct, we’ve completed the first bigger ABC down from the top, making the first large wave ‘A’.
Unfortunately for anyone looking to short higher up, all the next wave ‘B’ has to do is overlap the action at 2960 – and that’s likely where all the sellers lie.
As we’re looking for a ‘B’ wave it might need to go sideways to upwards for a few days to unwind the oversold condition. ‘B’ waves are also often triangles.
Note: this calculation doesn’t work for the Dow or Nasdaq.
Attachments:
You must be logged in to view attached files.August 3, 2019 at 10:32 #27236“Well, according to Nomura’s quant insight team led by Masanari Takada, the answer is nothing good…
As Takada writes in his FOMC post-mortem analysis, in his baseline scenario, he expects selling of equities by CTAs and other such market participants “to not go beyond the clearing out of long positions; we would not expect these investors to start staking out new short positions unless the US economy were to suffer an obvious loss of momentum.” Which is precisely what Trump’s restart of the US-China trade war virtually assures.
Looking over the positioning of various speculative traders, Nomura says that it appears that the selling of US equities has been led by trend-following algos (CTAs, risk-parity funds). For the moment, then, the selling thus appears to be mostly technically driven.
As the Nomura quant notes, “trend-following CTAs seem to be prioritizing exits from long positions in US equity futures. Having recently built up sizable net long positions in both S&P 500 futures and NASDAQ 100 futures, CTAs are now paring those positions in response to uptick in volatility and shift in market tone that followed the FOMC meeting.”
“However, the selling by CTAs is as of yet just a matter of profit-taking. According to Takada, the average break-even line for CTAs’ net long position in S&P 500 futures is at around 2,960, below which the selling will accelerate in linear fashion. Which is precisely where the S&P is trading as of this moment.”
“So once the stops are taken out, Nomura then sees the S&P 500 being taken down into the 2,850-2,900 range. Meanwhile, Takada also warns that “the US rates market may well start moving in a way that pressures the Fed to cut policy rates again in September”.
“And here comes the punchline, because according to the Nomura quants, “if the latter half of August brings increasingly clear signs that the pick-up in US economic indicators is running out of steam, there could be a global run of stock-selling by CTAs and fundamentals-oriented investors alike.” In that event, Takada believes there would be a plausible tail risk of US stocks sinking into crisis-driven market conditions in September comparable to those that prevailed at the time of the Lehman crisis. If this were to happen “the Fed, having fallen behind the curve, would be dragged into making an emergency rate cut of at least 50bp.“
-
AuthorPosts


- You must be logged in to reply to this topic.